Data Analysis of Wound Healing and Cell Migration Assays
| Cicatrisation des plaies et essais de migration cellulaire sont des outils in vitro puissants mais simples pour étudier la dynamique de la migration cellulaire et les interactions cellule-cellule. Pour obtenir des analyses puissantes à partir de ces essais, il est nécessaire de prendre en compte plusieurs aspects avant, pendant et après l'expérience afin d'assurer des résultats corrects et reproductibles. Cette Note d'Application offre des lignes directrices pour l'analyse pratique après la collecte des données issues des expériences de cicatrisation des plaies et de migration. | 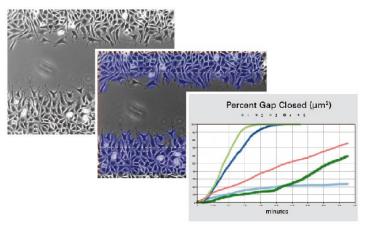 |
| ibidi propose différentes solutions pour les essais de cicatrisation: • Culture-Insert 2 puits dans µ-Dish 35 mm, haut et µ-Dish 35 mm, low • Culture-Insert 2 puits dans µ-Plate 24 Well • Culture-Insert 3 puits dans µ-Dish 35 mm, high • Culture-Insert 4 puits dans µ-Dish 35 mm, high • Culture-Inserts pour auto-insertion en format 2 puits, 3 puits, ou 4 puits. |
 |
|
|
Vous trouverez des instructions expérimentales plus détaillées dans : Note d'application 36 : "Essai de cicatrisation utilisant le Culture-Insert 2 puits dans une µ-Plate 24 puits" (PDF) Note d'application 30 : "Data Analysis of Wound Healing and Cell Migration Assays" (PDF) |
||
1. Calculating the Wound Closure Speed
The primary metric of a wound healing and cell migration assay is the rate of gap closure (alternative names: e.g., speed of wound healing, gap area coverage rate, wound closure rate), which is calculated as a percentage of the initial gap closure or in absolute units over time. The rate of gap closure is measured based on either the two-point measurement or ten-point (or more) measurement, as detailed in Application Note 30 “Optimizing Wound Healing and Cell Migration Assays” (PDF). To calculate the rate of gap closure:
1) Use an appropriate software (e.g., R, GraphPad Prism, Excel) to plot a graph visualizing the cell-covered area per time.
2) Define the linear phase (the rate of gap closure remains constant).
3) Compute a trend line for the linear phase.
4) Determine the slope of the trend line, which corresponds to the rate of gap closure (units of surface area covered per unit of time, for example 613 μm²/min).
This calculated slope provides a quantitative basis for evaluating the effectiveness of cell migration and proliferation in the experimental context.
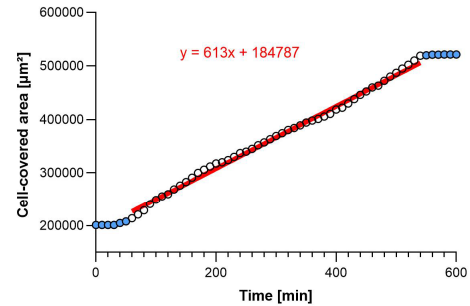
Plot visualizing a typical differential surface coverage with the red trend line for the linear phase. The trend line equation is shown.
2 Calculating the Cell Front Velocity / Data Normalization
Wound healing experiments vary in technical parameters like gap widths, cell front numbers, and imaging techniques using different cameras or microscopes. Normalizing for these technical variations is crucial to ensure comparability of wound closure speed across different setups. This process transforms the raw wound closure speed into a standardized metric known as the cell front velocity. The cell front velocity is independent from the initial gap width, the number of migrating cell fronts, or the size of the image section.
The cell front velocity is independent from the initial gap width, the number of migrating cell fronts, or the size of the image section.
The following formula calculates the cell front velocity:
![]()
Formula details:
• Rate of gap closure is the rate at which the cell-covered area increases over time, typically obtained from the slope of the trend line in the linear phase (see Chapter 1, e.g., 613 µm²/min).
• Length of cell front is the height or length of the image, depending on the gap orientation (e.g., 686.67 μm).
• N (equals 1 or 2) is the number of migrating cell fronts involved in closing the gap. For assays with two converging cell fronts, which is the case when using the ibidi CultureInsert 2 Well, N would be 2.
Example calculation:
![]()
3 Statistical Evaluation
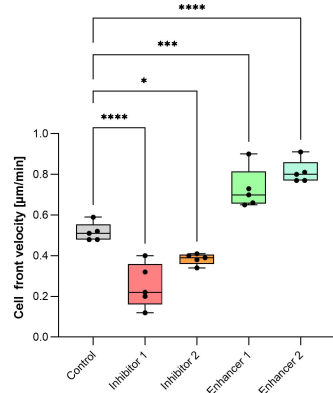
Normalized cell front velocities allow for comparisons between experiments. A minimum of three biological replicates per treatment condition is recommended to ensure statistical significance. These replicates should be aggregated into mean values, accompanied by error estimations such as the standard deviation or standard error. The collective data are best visualized using box plots, which provide a comprehensive representation of the data distribution, including median, quartiles, and potential outliers. Following data presentation, rigorous statistical analysis is essential. For example, an ANOVA can be applied to determine the significance of differences between treatment groups, with subsequent post hoc tests or their nonparametric equivalents for datasets that deviate from normal distribution. Such statistical testing is essential to validate the reliability of conclusions derived from wound healing tests.
Example results of a wound healing assay.